Hi,
I work at several customers managing their SCOM environment. In all those environments I come across the same questions eg.:
- Can you configure monitoring of Windows Service X on these servers?
- Can you configure monitoring of Windows Service Y on all the Windows Servers?
This involves some steps to be taken:
- Create a Windows Computer group containing the necessary servers (even for 1 server I tend to do that as this keeps things “cleaner” in SCOM)
- Look for the service name of the service(s) that need to be monitored
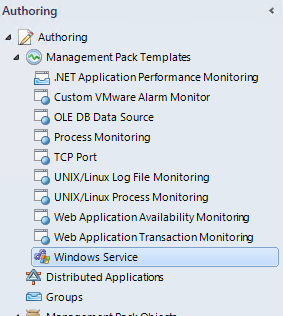
- Create a Windows Service monitor in SCOM using the Management Pack template available in the SCOM Console (under Authoring)
Performing those steps takes some time. Especially when you need to do it multiple times. I thought about a way to do this more efficiently/faster. Therefore I developed a powershell script in my spare time.
Prerequisites of the script:
- User running the script must be member of the SCOM Administrator group
- The great OpsMgrExtended module of Tao Yang needs to be installed (GitHub – tyconsulting/OpsMgrExtended-PS-Module)
Take note that I’ve tested the script directly on the SCOM management server.
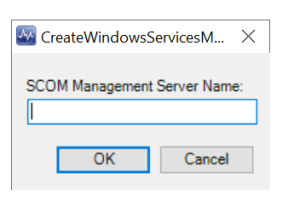
When the script launches you need to enter the FQDN of any SCOM management server in your environment
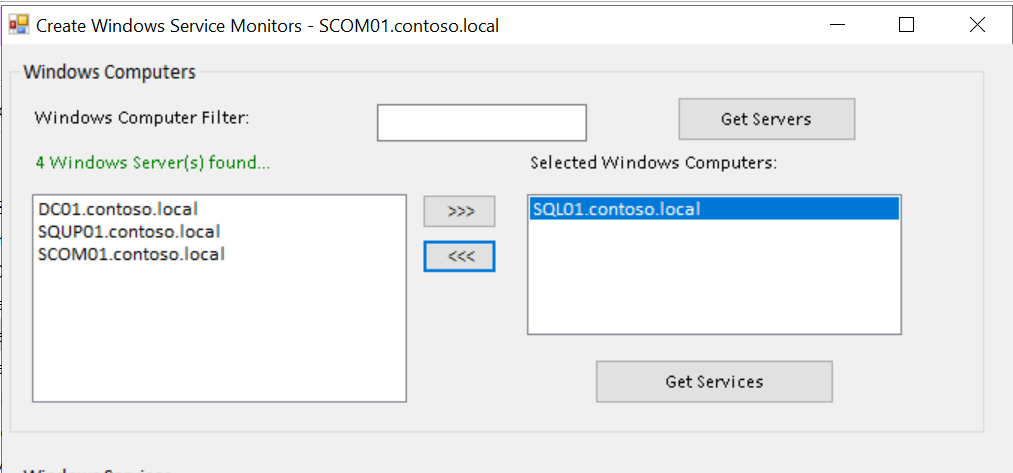
After filling in the the FQDN the script launches and fetches all Windows Computers in your SCOM environment. At the top you can filter on any part of a Windows Computer name, might be handy in case of a lot of servers in your environment. In my lab I don’t really need that :).
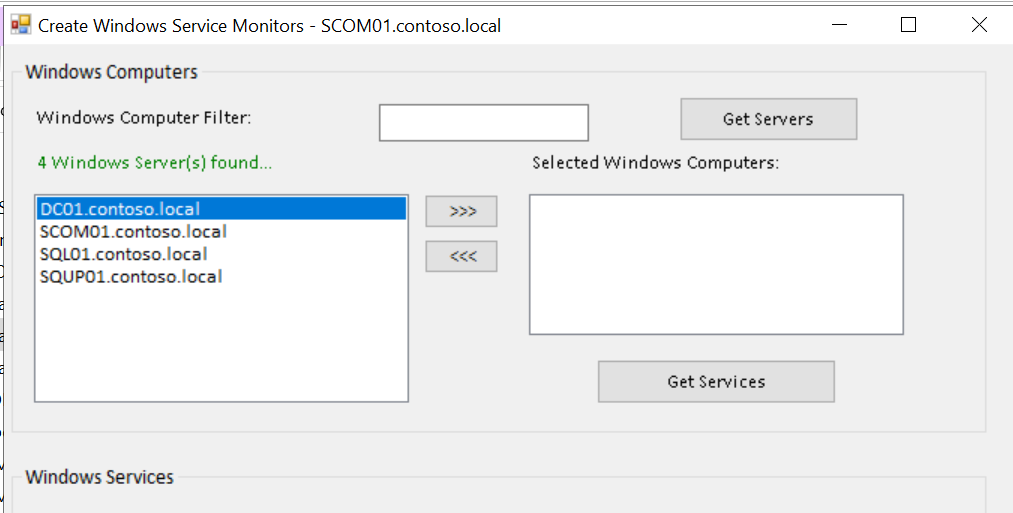
Click any server you want to monitor services from and click the Add (>>>) arrows. Add additional servers if needed (if you want to monitor the same service on multiple servers). In this case I’ll add my SQL server as I want to monitor some SQL service:
When the server is selected, click Get Services. The script will try to fetch services locally from that server using remote WMI. So be sure that is allowed. If everything goes well a list of installed services is shown.
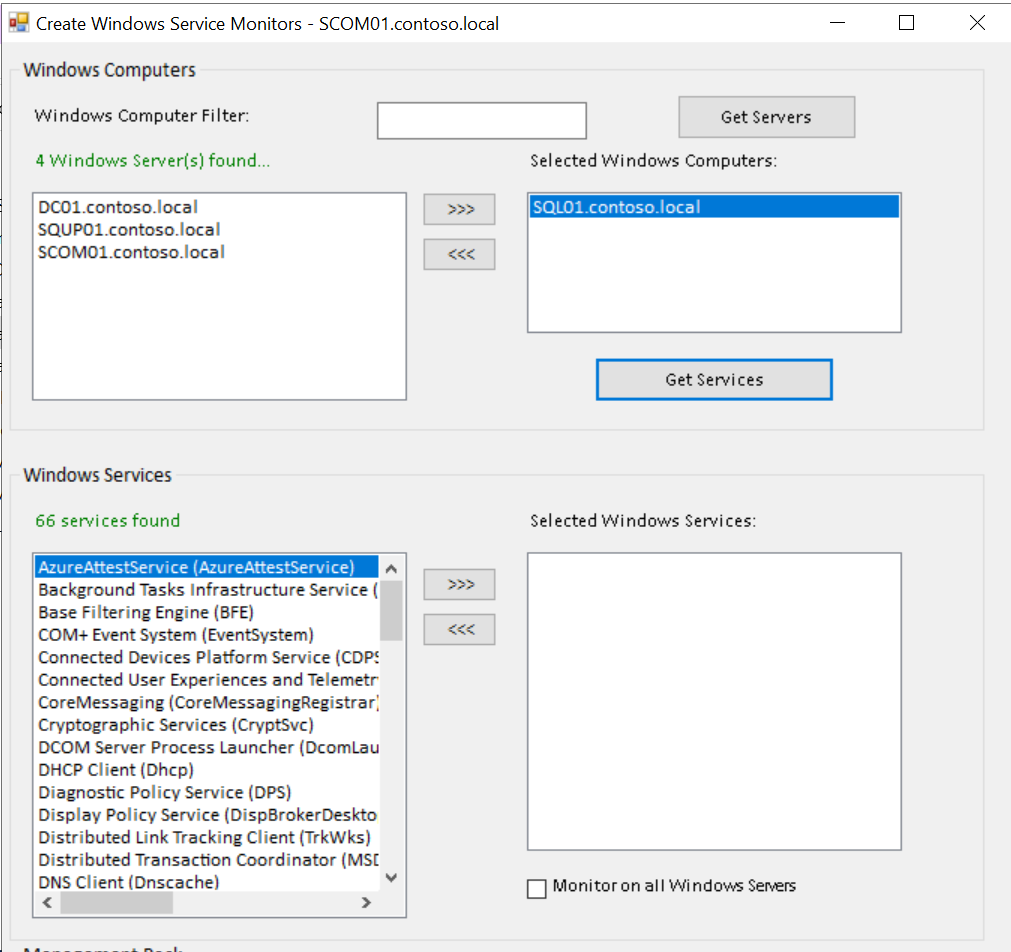
Now you can scroll through the list and select the Windows services and add services (using >>>) to be monitored. Multiple services can be added. Let’s add 2 services as an example.
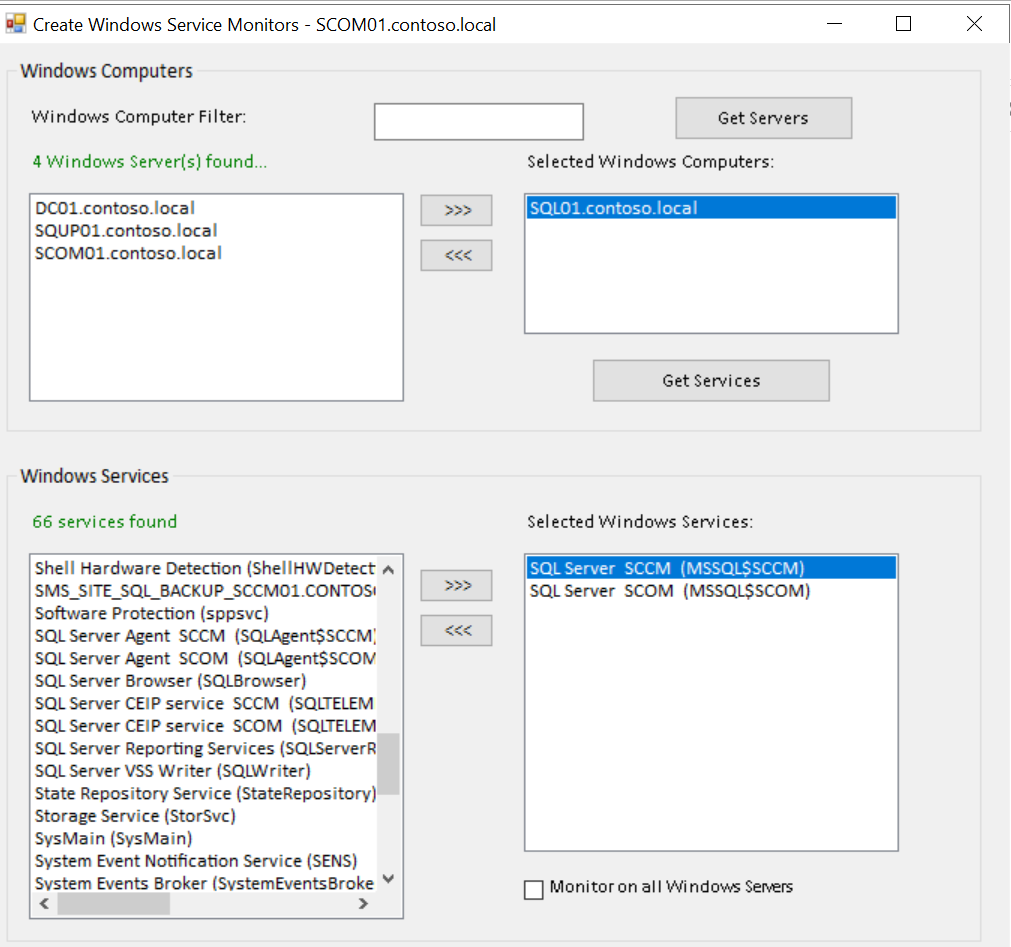
There is also a checkbox “Monitor on all Windows Servers” there. This can be checked if you have 1 or more Windows Services you want to monitor on ALL Windows Servers in your environment. If you leave it unchecked, the script will create a computer group containing the servers selected previously. If you check it the monitor will be targeted to the All Windows Computers Group.
Final step is adding a management pack prefix, I usually put the customer name there:
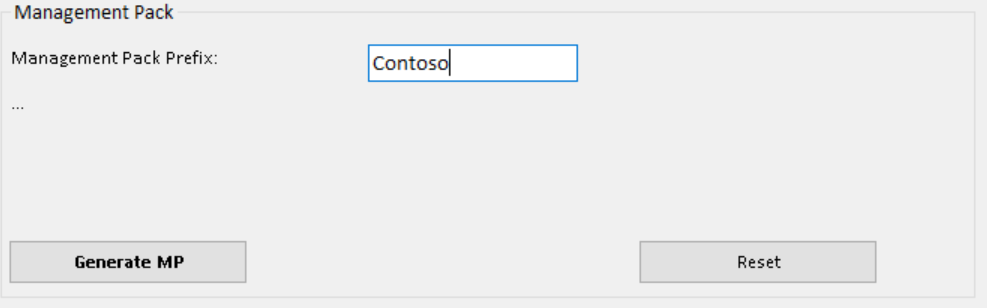
Now everything is ready to generate the Management Pack. When clicking in the background the following things will happen:
- A management pack will be created
- Monitor on all Windows Servers UNCHECKED:
- A computer group will be created with all servers selected in the GUI
- Necessary service monitors will be created and targeted to the newly created group
- Monitor on all Windows Servers CHECKED:
- Necessary service monitors will be created and targeted to the All Windows Computers Group
Clicking the Reset button will simply clear all input and you can start all over.
How does this look in SCOM:
Management Pack

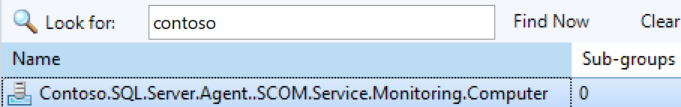
Computer Group
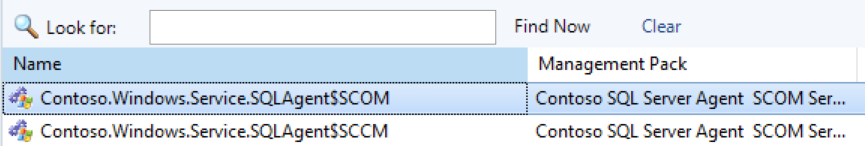
Service Monitors
Doing this it only took me around 1 minute to setup monitoring of those services. When doing the same through the SCOM console it took me around 5 minutes. So when you need to create service monitors regularly it saves a lot of time.
If you are interested in this tool, I’ve compiled an EXE which I can share, just drop me a mail on bert@bpitconsulting.be
Hope this helps!